This free 5G NR field guide is for engineers who must connect what exists on the site, what was configured, what became active in the trace and what the user actually received.
That chain starts with antennas, radios, power and transport. It continues through baseband functions, RRC configuration, MAC scheduling and PHY transmission. It ends in an application result experienced by a user.
This guide connects those views.
It is written for engineers who can already recognise terms such as SSB, BWP, PDCCH, CQI or handover, but still need to answer a harder question:
Which evidence should I inspect next when the observed result does not match the configuration or the KPI summary?
- 111 pages
- 13 original diagrams
- 1 real anonymised case
- No email required
The field rule: follow the service chain
When a KPI changes, do not start by changing a parameter.
Start with five checks:
- define the affected site, sector, cell, service, UE population and time window;
- locate the first physical or logical boundary where the result diverges;
- align alarms, traces, counters and changes to the same clock;
- compare the affected interval with a known-good interval;
- run one test that can disprove the leading hypothesis.
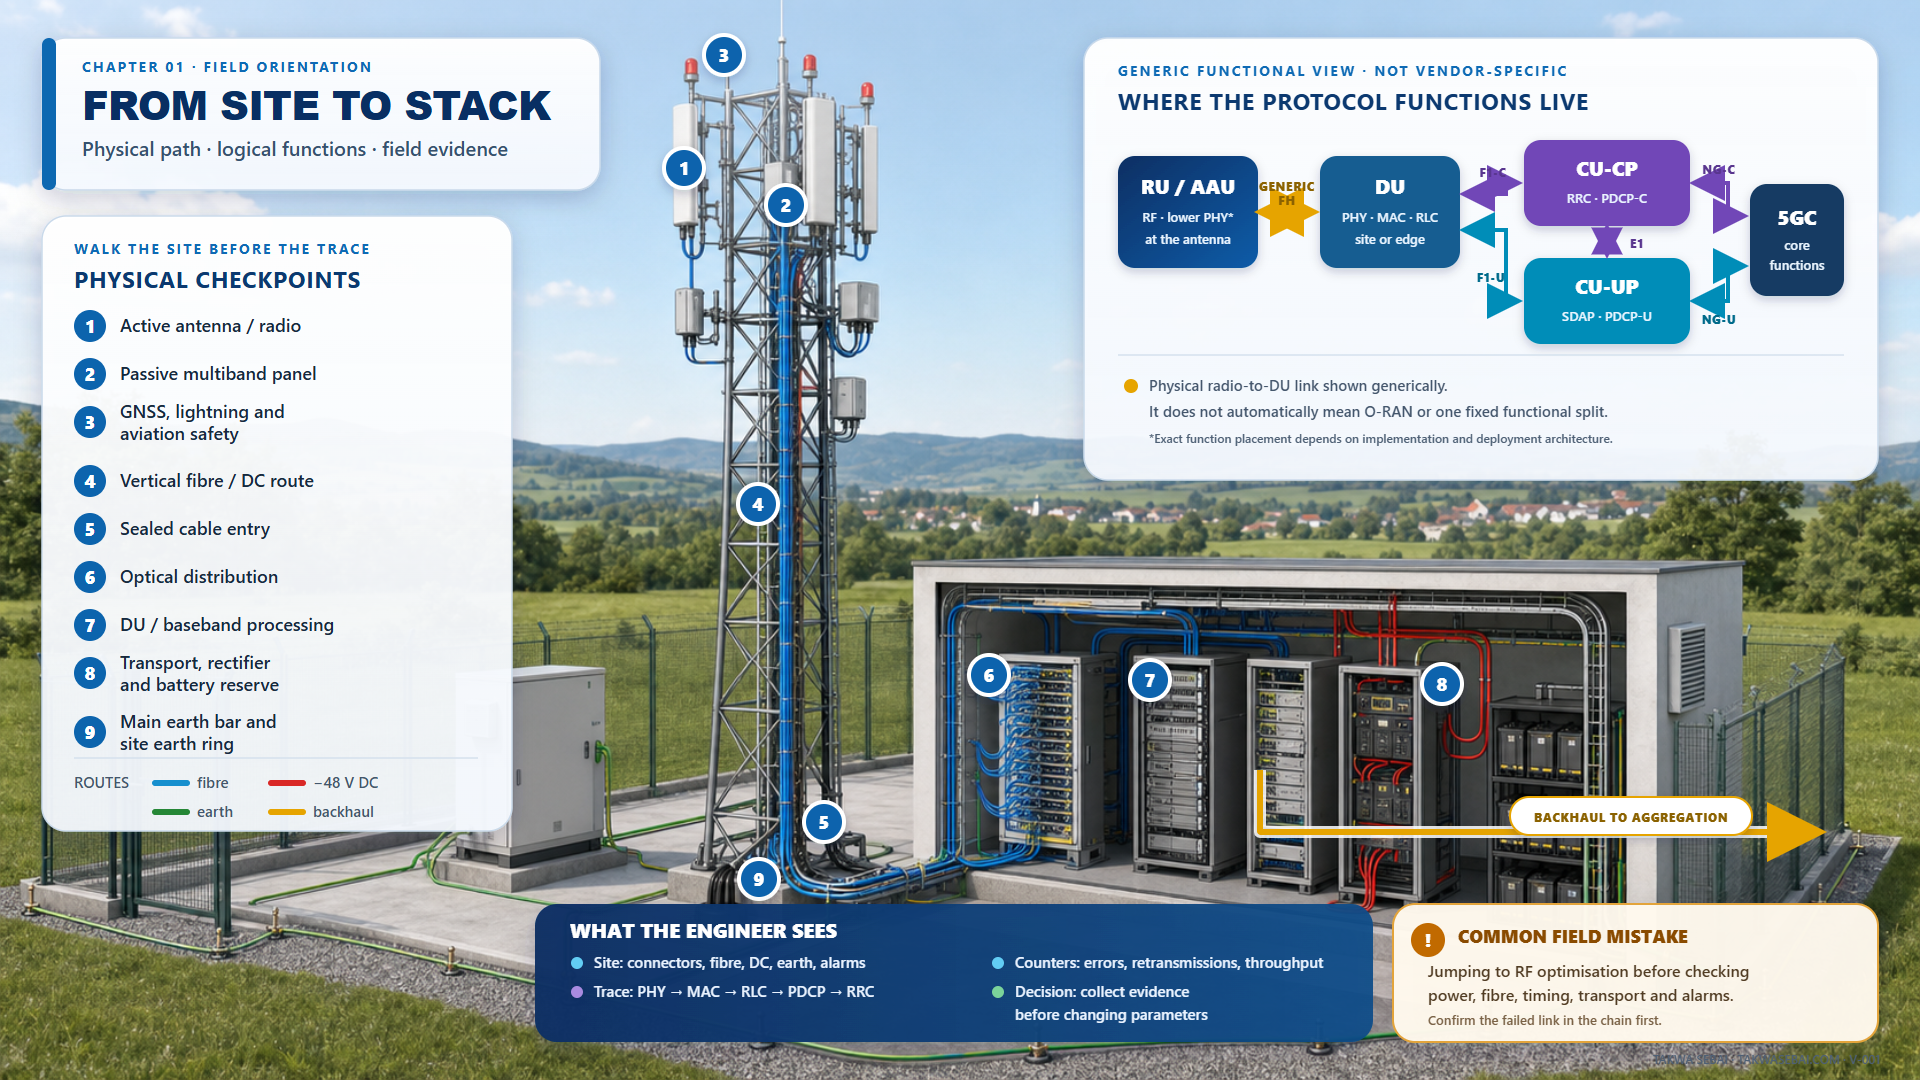
Original Takwa Sebai field plate. The layout is generic and the annotations connect physical equipment to logical evidence. It is not a vendor deployment design.
1. Start with the physical route
The protocol trace is not a replacement for the site.
A physical investigation may include:
- antenna panels and RF ports;
- radio units and feeder or jumper paths;
- fibre or other fronthaul links;
- baseband and distributed or centralised functions;
- power conversion, battery reserve and grounding;
- transmission equipment and backhaul;
- timing and synchronisation sources;
- environmental alarms and recent maintenance.
The exact architecture depends on the deployment. The diagnostic principle does not: a logical symptom can be downstream of a physical constraint.
Before opening a trace, record:
- where the symptom is observed;
- whether all sectors or only one branch are affected;
- whether the issue follows a cell, a UE, a route or a time window;
- which maintenance or configuration changes occurred;
- whether a neighbouring or equivalent path remains healthy.
Read the site-to-stack architecture guide.
2. Numerology defines a grid, not a complete design
In NR, the subcarrier-spacing relationship is:
Δf = 2^μ × 15 kHz
The formula is necessary. It is not a deployment decision by itself.
A numerology choice sits inside constraints that include:
- operating band and channel bandwidth;
- duplex mode and TDD pattern;
- expected delay spread and mobility;
- scheduling and latency objectives;
- UE capability;
- RF coverage and interference;
- available bandwidth parts;
- implementation and release support.
A throughput difference between two cells does not prove that numerology caused it. The cells may also differ in bandwidth, MIMO rank, PRB allocation, load, RF quality, transport or policy.
The useful field question is:
What changed with the grid, what remained different, and which measurement isolates the effect?
Read the numerology decision guide.
3. A configured BWP is not proof of the active BWP
A carrier can contain several configured bandwidth parts. The UE operates in a specific downlink and uplink context at a given instant.
Keep these objects separate:
- carrier bandwidth;
- initial BWP;
- configured dedicated BWP;
- first active BWP;
- default downlink BWP;
- active downlink and uplink BWP at the measured instant.
The configuration tells you which states are possible. It does not, by itself, prove the state at the exact time of a throughput sample.
To reconstruct the active state, align:
- RRC configuration;
- applicable DCI indication;
- inactivity-timer behaviour;
- random-access or serving-cell events where relevant;
- UE or network logs;
- allocation and performance from the same interval.
See the BWP evidence workflow.
4. SSB coverage is not the same object as the traffic beam
An SSB result can support cell search and measurement. It does not automatically identify the lower-layer beam that carried a later PDSCH transmission.
Separate three levels:
- the cell-level result;
- the measurement associated with an SSB index;
- the beam, TCI state or lower-layer context used for control or data.
A strong SS-RSRP may coexist with:
- poor SS-RSRQ or SS-SINR;
- unstable per-index measurements;
- unreliable control reception;
- lower rank;
- high BLER;
- low scheduling frequency;
- poor application throughput.
The conclusion must stop at the evidence boundary. A “best SSB changed” observation is not automatically a beam-failure diagnosis.
Read the SSB and beam field guide.
5. Control must succeed before data can be delivered
PDCCH and PDSCH are related, but they are not interchangeable observations.
An engineer should keep these stages separate:
- CORESET resources are configured;
- a Search Space defines monitoring opportunities and candidates;
- the scheduler decides whether and how to schedule;
- control resources are allocated;
- the UE successfully detects the applicable DCI;
- the corresponding PDSCH allocation is transmitted and decoded;
- useful data reaches the higher layer and application.
Fewer DCI decodes at a UE are an observation. They do not prove, without network evidence, how many PDCCH transmissions were attempted or why a specific opportunity was not used.
Follow the CORESET to PDSCH evidence chain.
6. Read radio measurements together
One KPI rarely closes a radio diagnosis.
A defensible review aligns:
- SS-RSRP, SS-RSRQ and SS-SINR;
- CSI assumptions and reporting context;
- CQI and RI;
- scheduled MCS and layers;
- PRB allocation and scheduling frequency;
- initial and residual BLER;
- HARQ outcome;
- application throughput;
- load, position, UE state and test conditions.
These values may come from different clocks and resources. “Same timestamp” in two tools does not always mean the same radio instant.
The field sequence is:
- identify the measured resource;
- confirm the averaging and reporting context;
- align position and time;
- map the report to the scheduling interval;
- compare radio quality, allocation and delivery;
- stop if only one KPI supports the hypothesis.
Read the RSRP, RSRQ and SINR correlation guide.
7. Mobility diagnosis is a phase-localisation problem
“The handover failed” is not a location.
For NSA or dual-connectivity investigations, identify:
- the LTE Master Node;
- the NR Secondary Node;
- the relevant PCell and PSCell;
- whether the procedure is addition, modification, change, release or Master Node mobility;
- the RRC response;
- target or PSCell access;
- user-plane activation and delivered data.
For SA handover, separate:
- preparation;
- command delivery;
- target synchronisation and random access;
- target RRC completion;
- path switch;
- release of the source context;
- post-handover service.
The last positive evidence shows how far the procedure progressed. The first missing evidence defines the next check. Neither one identifies a physical root cause without supporting proof.
Use the 5G handover troubleshooting flow.
8. Low throughput must choose a branch
“Throughput is low” is incomplete until the measurement point, direction, test contract and expected comparison are named.
Start by freezing:
- downlink or uplink;
- server and path;
- protocol and parallel streams;
- duration and clock;
- UE model, capability and thermal state;
- SIM or subscription;
- position and mobility;
- cell, carrier, BWP and aggregation state.
Then force the ceiling into one of four branches:
- RF quality and radio efficiency;
- scheduler, allocation and capacity;
- transport and test path;
- policy, configuration or UE.
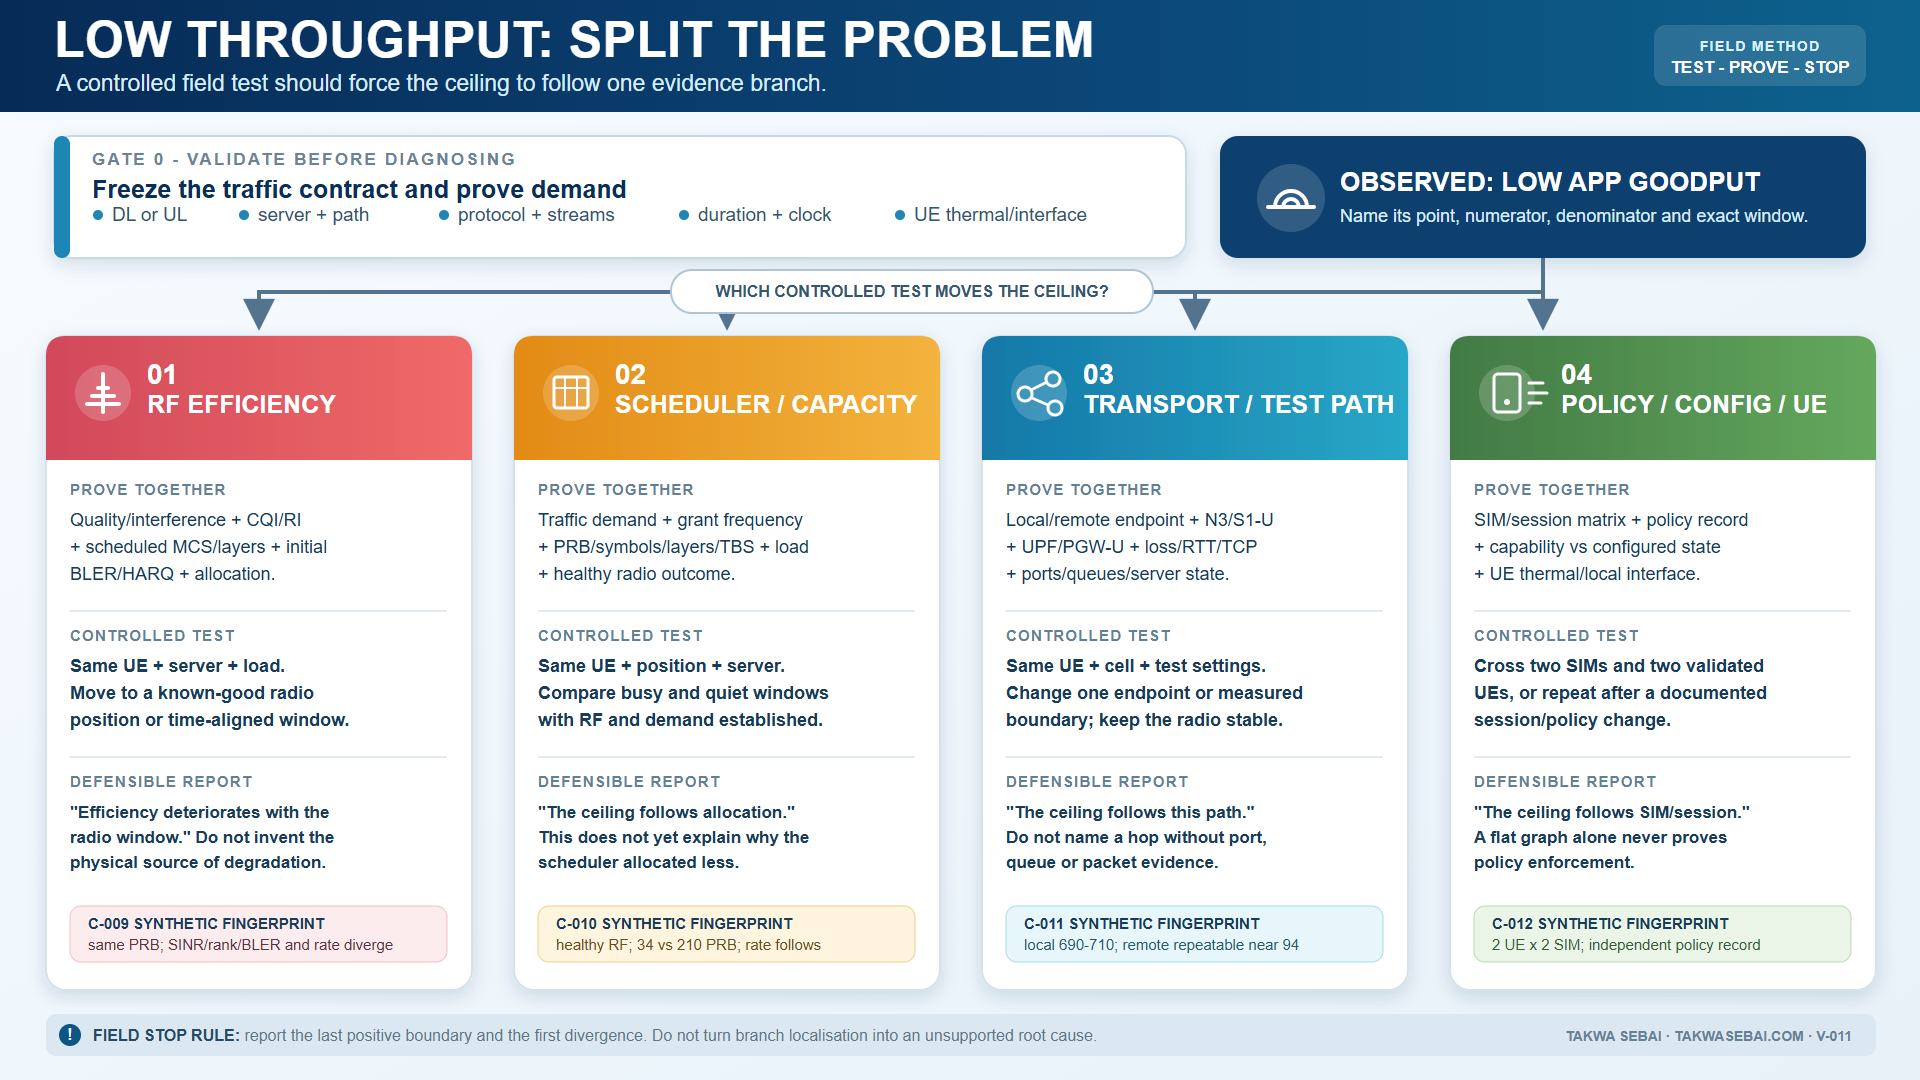
Original diagnostic framework. The branch examples are synthetic and are used to separate evidence, not to publish universal thresholds.
Each branch requires:
- evidence that should move together;
- one controlled comparison;
- a statement of what the result proves;
- a statement of what it still does not prove.
Open the complete low-throughput workflow.
A practical evidence vocabulary
Use labels that show the strength of every statement:
| Label | Meaning |
|---|---|
| Confirmed | Directly present in an authoritative source, configuration or trace |
| Observed | Measured or recorded in a defined window |
| Expected | Predicted from documented configuration or procedure |
| Inferred | Supported by several observations but not directly measured |
| Declared | A synthetic training assumption |
This vocabulary prevents a common reporting failure: turning a plausible interpretation into a fact.
Download the complete illustrated field edition
The complete 5G NR From Site to Trace English field edition contains:
- 111 A4 pages;
- 8 connected chapters;
- 13 original field diagrams;
- evidence checklists;
- synthetic training cases with explicit labels;
- public Release 18 references;
- field stop rules that limit unsupported conclusions.
View the complete ebook and download options.
The articles remain useful without the download. The PDF is the continuous reference version for engineers who want the entire workflow in one place.
Public technical references
- ETSI TS 138 401, NG-RAN architecture description.
- ETSI TS 138 211, NR physical channels and modulation.
- ETSI TS 138 213, NR physical-layer procedures for control.
- ETSI TS 138 214, NR physical-layer procedures for data.
- ETSI TS 138 215, NR physical-layer measurements.
- ETSI TS 138 300, NR and NG-RAN overall description.
- ETSI TS 138 321, NR MAC protocol specification.
- ETSI TS 138 331, NR RRC protocol specification.
KEEP THE EVIDENCE PATH