Low throughput is not a root cause. It is a result measured at one point in a longer service path.
The first useful question is not “Which parameter should I change?”
It is:
Which controlled test makes the throughput ceiling move, and which boundary does that result actually prove?
Direct answer
Use this sequence:
- validate the traffic test;
- prove that traffic demand exists;
- name the exact throughput measurement point;
- separate radio efficiency from resource allocation;
- separate downlink from uplink;
- compare with a known-good interval;
- force the result into an RF, scheduler, transport or policy/UE branch;
- report the last positive boundary and the first divergence.
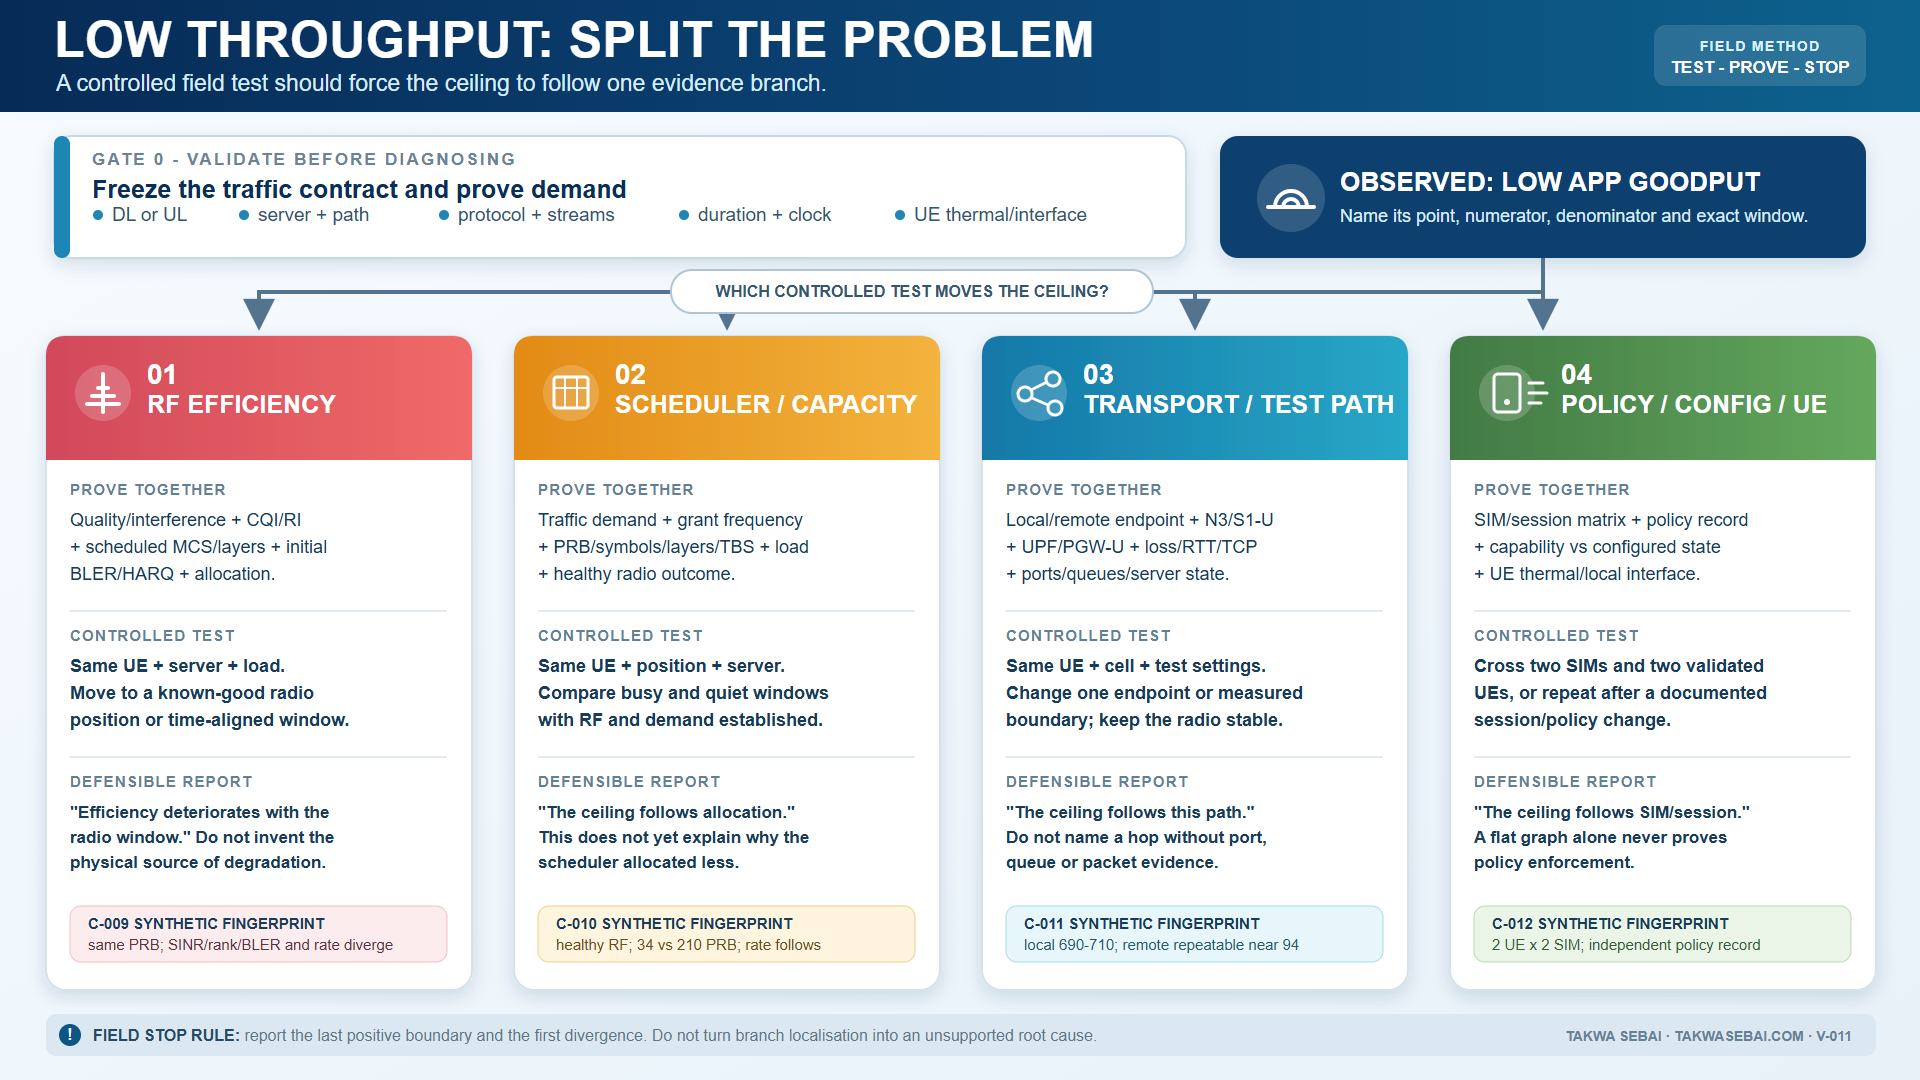
Original Takwa Sebai field framework. Numerical fingerprints in the visual are synthetic training values, not universal thresholds.
Gate 0: validate the test before diagnosing the network
Freeze the test contract:
| Test item | Record |
|---|---|
| Direction | Downlink or uplink |
| Endpoint | Server name, location and ownership |
| Protocol | TCP or UDP |
| Streams | Number of parallel flows |
| Duration | Exact test window |
| UE | Model, capability, software and thermal state |
| Radio state | RAT, carrier, BWP, aggregation and layer state |
| Subscription | SIM, APN/DNN, slice or policy context where applicable |
| Position | Static or mobile, with a repeatable location |
| Clock | Time source used across UE, RAN, transport and application |
Do not compare two results until the important differences are explicit.
A test with a different server, stream count, UE temperature or subscription may answer a different question.
Gate 1: prove demand
A scheduler cannot allocate traffic that is not requested.
Before interpreting PRBs or grants, confirm:
- the application or test tool requested enough data;
- the TCP window or UDP offered load can sustain the target;
- no application pause or server cap is present;
- traffic exists in the direction being diagnosed;
- the measured interval excludes setup and teardown where appropriate.
If demand is missing, the radio may be idle by design.
Gate 2: name every throughput number
“The throughput is 100 Mbit/s” is incomplete.
Name:
- measurement point;
- direction;
- numerator;
- denominator;
- aggregation interval;
- protocol overhead included or excluded;
- retransmissions included or excluded;
- clock and time window.
Possible values include:
- application goodput;
- UE interface throughput;
- PDCP volume over time;
- RLC or MAC delivery;
- PHY transport-block throughput;
- RAN PM throughput;
- N3 or S1-U interface volume;
- UPF or PGW-U traffic;
- server-interface throughput.
These figures can differ legitimately.
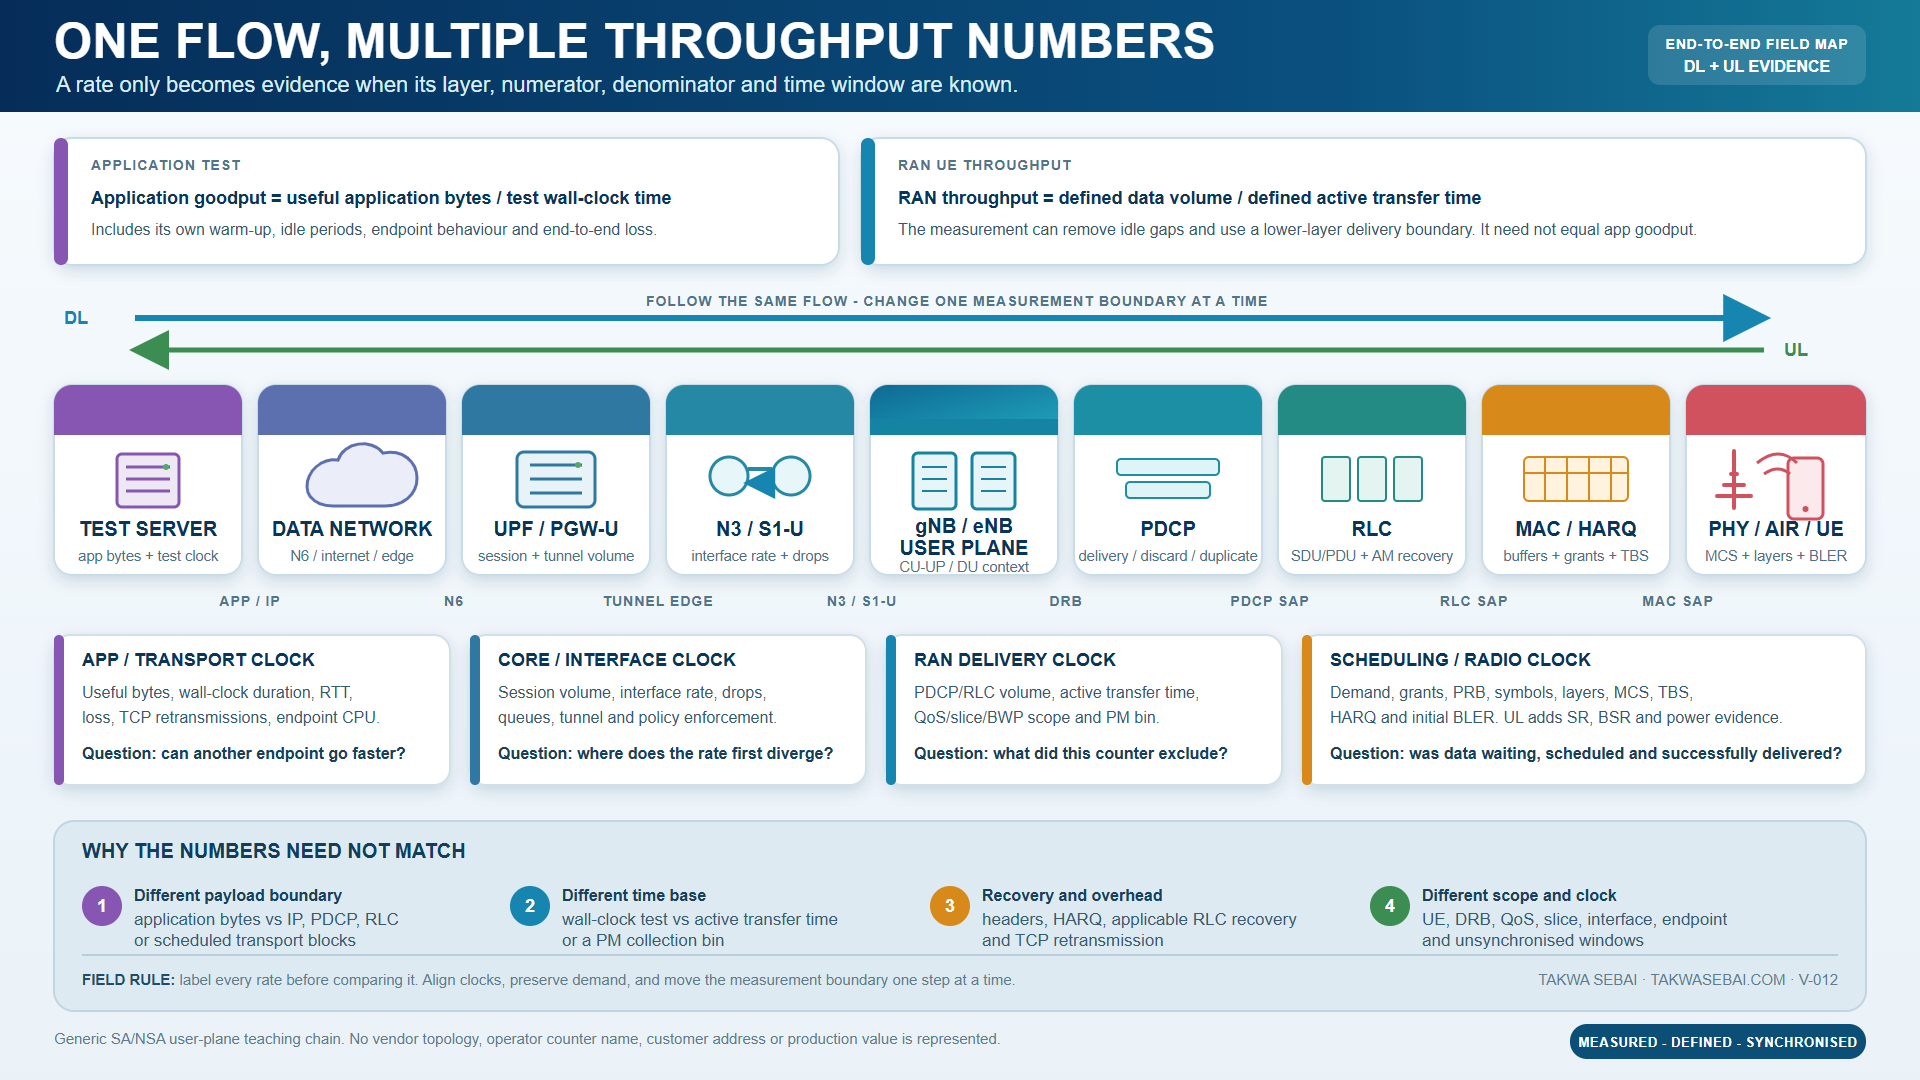
Original measurement map. The topology is generic and does not represent an operator network.
Branch 1: RF quality and radio efficiency
Check whether the observed radio conditions support the scheduled transmission:
- SS-RSRP or CSI-RSRP on the correct resource;
- SS-RSRQ or CSI-RSRQ;
- SS-SINR or CSI-SINR;
- CQI and its reporting context;
- scheduled MCS;
- rank and scheduled layers;
- initial and residual BLER;
- HARQ retransmission outcome;
- allocation during the same window.
Controlled test
Keep the UE, traffic test and server constant. Move to a known-good radio position, or compare a time-aligned known-good interval.
Defensible conclusion
If radio quality, MCS, rank, BLER and delivered throughput improve together while the path and allocation remain comparable, the ceiling follows the radio condition.
This still does not identify the physical source of degradation. Interference, coverage, hardware, beam state and implementation behaviour remain separate hypotheses.
Branch 2: scheduler, allocation and capacity
Healthy radio efficiency does not guarantee that resources were allocated.
Check:
- active traffic demand;
- scheduling frequency;
- downlink and uplink grants;
- PRBs, symbols or layers allocated;
- MCS and transport-block size;
- number of active UEs;
- cell load over the same interval;
- carrier and BWP actually used;
- control-channel evidence where relevant.
Controlled test
Repeat the same test at the same position and with the same server during a quiet interval and a busy interval.
Defensible conclusion
If RF efficiency remains healthy but PRB allocation or scheduling frequency falls with load, the ceiling follows allocation.
This does not prove why the scheduler allocated less. Admission control, QoS, control resources, implementation policy and competing traffic may still need investigation.
Branch 3: transport and test path
A strong radio result can coexist with a path ceiling.
Check:
- local and remote endpoints;
- N3 or S1-U interface evidence;
- UPF or PGW-U throughput;
- N6 or external data-network path;
- RTT, loss and retransmissions;
- interface errors, drops and queue counters;
- port speed and negotiation;
- server CPU, NIC and application limits.
Controlled test
Use the same UE, cell and radio settings. Change one endpoint or one measured boundary while keeping the radio stable.
Defensible conclusion
If a local known-good server delivers the expected rate and a remote path repeatedly plateaus lower under comparable radio conditions, the ceiling follows the tested path.
This does not identify a specific router, port or queue unless interface evidence localises the divergence.
Branch 4: policy, configuration or UE
When a plateau follows a SIM, session or device, use a controlled matrix.
Check:
- UE capability and negotiated feature set;
- realised carrier aggregation and MIMO layers;
- active BWP and bandwidth;
- UE temperature and local interface;
- subscription and session policy;
- QoS flow and AMBR-related context where applicable;
- APN or DNN and slice selection;
- device software and configuration.
Controlled test
Cross two UEs and two validated SIMs, or repeat after one documented policy or configuration change.
Defensible conclusion
If the ceiling follows the SIM across two capable UEs, the policy or subscription branch is supported.
A flat graph alone never proves policy enforcement.
Four synthetic fingerprints
The following are diagnostic exercises, not benchmark thresholds.
C-009: ceiling follows the RF branch
In a synthetic downlink comparison, the degraded window combines worse SS-SINR, lower CQI and MCS, rank 1, higher initial BLER and lower throughput than a known-good window.
The exercise supports the RF branch because several radio-efficiency indicators move together. It does not identify interference, coverage or hardware as the root cause.
C-010: ceiling follows allocation
At the same synthetic radio position, RF efficiency remains healthy while average PRB allocation and throughput fall during a busier interval with more active UEs.
The exercise proves an allocation limitation inside the comparison. It does not define a universal cell-capacity threshold.
C-011: ceiling follows the tested path
The same synthetic UE and cell deliver a high rate to a local known-good server, while a distant path repeatedly plateaus near a lower value.
The result follows the path. It does not localise the exact link or equipment.
C-012: ceiling follows the policy or subscription branch
In a synthetic two-UE, two-SIM matrix, one SIM produces the same lower plateau on both UEs and the other SIM produces the higher rate on both.
The branch is localised to subscription or policy evidence. The exact rule still requires the policy record.
Evidence matrix before writing the root cause
| Evidence layer | Last positive evidence | First divergence | What remains unproven |
|---|---|---|---|
| Test contract | Stable server, streams and duration | None | Network diagnosis may proceed |
| Demand | Application is continuously requesting data | None | Allocation still unknown |
| Radio efficiency | Healthy quality, MCS, rank and BLER | None | Resource availability unknown |
| Allocation | Grants and PRBs decrease in the affected window | Scheduler boundary | Reason for the scheduler decision |
| Transport | Stable to the local endpoint | Remote path plateau | Exact link or queue |
| Policy/UE | Ceiling follows the SIM | Subscription boundary | Exact policy rule |
Field checklist
- [ ] Direction, endpoint, protocol, streams and duration are recorded.
- [ ] UE capability, software and thermal state are recorded.
- [ ] SIM and session context are controlled.
- [ ] Demand is proven.
- [ ] Every throughput figure has a named measurement point.
- [ ] Radio efficiency and allocation are separated.
- [ ] DL and UL are analysed separately.
- [ ] A known-good comparison exists.
- [ ] One boundary changes per controlled test.
- [ ] The report states what remains unproven.
Field stop rule
Do not ask which counter is low. Ask where useful data stops progressing, and which controlled test proves that boundary.
Continue the workflow
- Read radio measurements together.
- Verify the active BWP at the test instant.
- See the complete 5G NR field guide.
Download the 12-page low-throughput field triage playbook to carry this sequence into the first investigation.
The free illustrated 111-page field edition combines this workflow with numerology, BWP, SSB, PDCCH and mobility.
Public technical references
- ETSI TS 138 214 V18.9.0, NR physical-layer procedures for data.
- ETSI TS 138 321 V18.9.0, NR MAC protocol specification.
- ETSI TS 138 322 V18.2.0, NR RLC protocol specification.
- ETSI TS 138 323 V18.5.0, NR PDCP specification.
- ETSI TS 128 552 V18.12.0, 5G performance measurements.
- ETSI TS 128 554 V18.9.0, 5G end-to-end KPIs.
- ETSI TS 123 501 V18.12.0, 5G system architecture.
KEEP THE EVIDENCE PATH