The most common mistake with 5G radio measurements is to turn one number into a diagnosis.
A strong RSRP does not guarantee high throughput. A low SINR does not identify the interferer. A “good range” copied from a chart does not prove what a specific UE, resource or time window experienced.
Direct answer
Use RSRP, RSRQ and SINR as different evidence:
- RSRP describes received power on a defined reference resource;
- RSRQ relates reference-signal power to received wideband power;
- SINR relates signal to interference-plus-noise under a defined measurement context.
Then correlate them with:
- the exact measured resource;
- CQI and RI;
- scheduled MCS and layers;
- BLER and HARQ;
- PRB allocation and scheduling frequency;
- application throughput;
- position, load and time.
There is no universal threshold table that closes every 5G diagnosis.
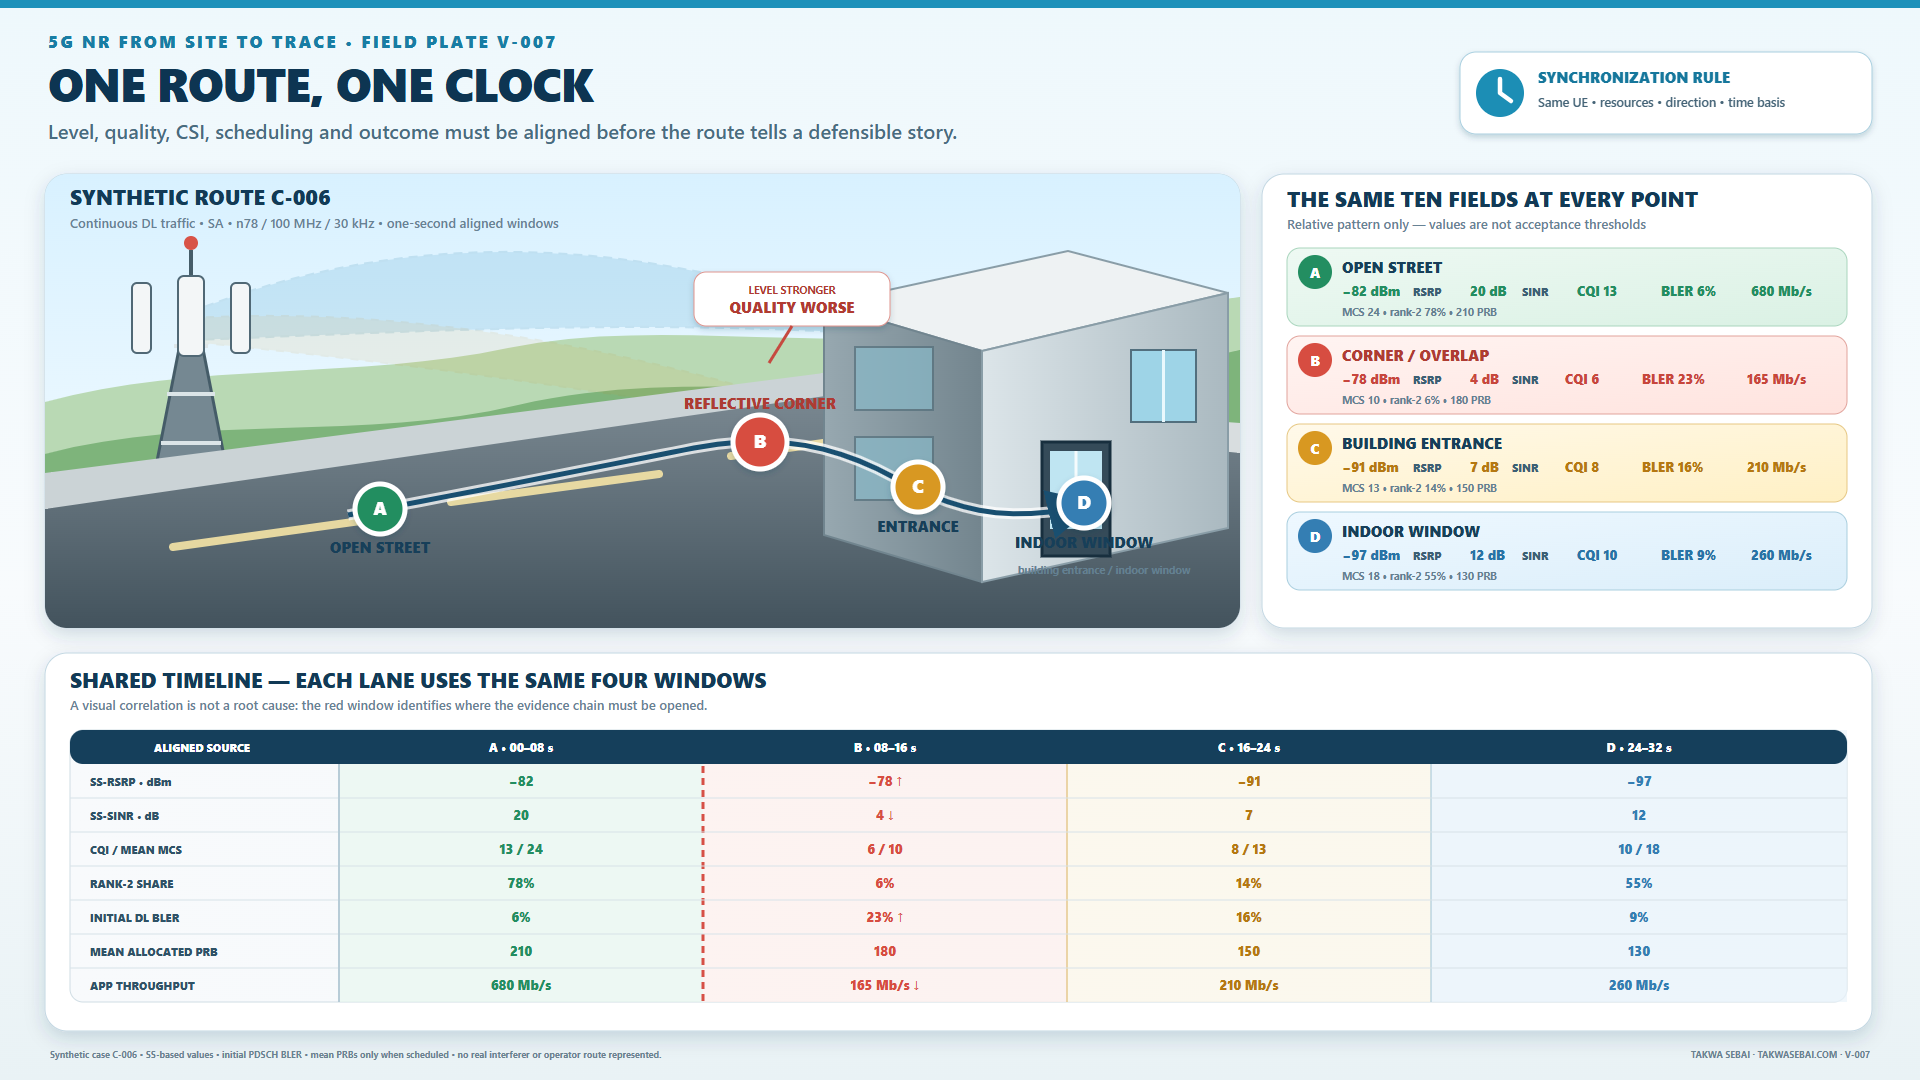
Original field plate using synthetic training values. It demonstrates synchronisation and evidence layers, not operator thresholds.
Start with the measured resource
Before interpreting a value, ask:
- Is the result based on an SSB or a CSI-RS?
- Is it a cell-level result or a per-index result?
- Which configured measurement object and report configuration apply?
- What averaging, filtering and reporting conditions apply?
- Is the value measured, logged by the UE, reported through RRC or aggregated in PM?
- Does the timestamp align with the traffic interval?
Two values with the same KPI name may describe different resources or windows.
What RSRP can and cannot prove
RSRP is a power measurement associated with defined reference-signal resource elements.
It helps answer:
- whether the reference resource is detectable;
- how received power changes by position or time;
- how one suitable reference-resource result compares with another.
It does not directly prove:
- interference level;
- control-channel reliability;
- MIMO rank;
- resource allocation;
- transport health;
- application throughput.
A strong RSRP can coexist with poor quality or low allocation.
What RSRQ adds
RSRQ combines reference-signal power with received wideband power in its definition.
It can respond to conditions that RSRP alone does not expose, including:
- higher received power outside the useful reference contribution;
- changes in load or interference conditions;
- differences between a clean and a busy interval.
RSRQ is not an interference detector by itself. The measurement resource, bandwidth and implementation context still matter.
What SINR adds
SINR compares the desired signal with interference plus noise under the applicable measurement definition.
It is closer to a quality ratio, but it still does not directly tell you:
- who generated the interference;
- which beam carried a later data transmission;
- which MCS the scheduler selected;
- how many PRBs were allocated;
- whether transport or policy imposed a ceiling.
Use SINR as part of a chain, not as the last line of the report.
Why a universal “good 5G range” is risky
Threshold charts can be useful as rough orientation, but they often hide:
- SSB versus CSI-RS measurement differences;
- band and bandwidth context;
- UE implementation and filtering;
- mobility and beam state;
- indoor and outdoor propagation;
- cell load and interference;
- scheduler behaviour;
- application and transport constraints.
If a site or project uses operational thresholds, record their source and purpose. Do not present them as universal 3GPP pass/fail values unless the specification actually defines that role.
Correlate the measurement with scheduling
The useful sequence is:
- identify the measured reference resource;
- align the measurement with the traffic window;
- inspect CQI and RI under the applicable reporting assumptions;
- inspect the MCS and layers that were actually scheduled;
- inspect initial BLER and HARQ outcome;
- inspect PRBs and scheduling frequency;
- compare delivered throughput.
Why CQI is not MCS
CQI is a UE report used by the network under configured assumptions. MCS is a scheduling decision.
They are related. They are not identical.
The scheduler may also consider:
- available resources;
- traffic demand;
- retransmissions;
- policy and QoS;
- implementation behaviour;
- link adaptation history;
- rank and layer decisions.
Why good MCS does not guarantee good throughput
High MCS with few scheduled PRBs may still produce low throughput.
Conversely, lower MCS with frequent scheduling and more resources may deliver a useful rate.
Always separate:
- efficiency per scheduled resource;
- quantity of resources allocated;
- frequency of allocation;
- final useful delivery.
Synthetic case: stronger level, worse service
This exercise is synthetic and contains no operator data.
A route contains four sample points:
- at the open location, SS-RSRP, quality, rank and throughput are healthy;
- near the approach, the strongest SSB index changes but service remains useful;
- behind a corner, SS-RSRQ and SS-SINR deteriorate, CQI and rank fall, BLER rises and throughput decreases;
- indoors, power and quality are both worse and delivered throughput falls further.
The evidence supports a broader radio-degradation question. It does not prove beam failure, an interferer or a hardware fault.
A second synthetic case: good radio, fewer resources
At one fixed synthetic position:
- SINR, CQI, MCS and BLER remain comparable;
- scheduling frequency and allocated PRBs fall in the busy interval;
- application throughput falls with allocation.
The result supports the scheduler or capacity branch, not the RF branch.
It still does not identify why resources were allocated differently.
Field workflow
Step 1: freeze the context
Record:
- cell and carrier;
- band and bandwidth;
- active BWP if applicable;
- measured resource;
- UE and software;
- position and movement;
- traffic test and direction;
- exact time window.
Step 2: normalise clocks
Document whether each source uses:
- device time;
- network time;
- GPS or GNSS;
- tool-local time;
- aggregated PM intervals.
Step 3: align evidence layers
Create one row per comparable interval:
| Layer | Evidence |
|---|---|
| Resource | SSB or CSI-RS identity and timing |
| Radio level | RSRP |
| Radio quality | RSRQ and SINR |
| UE report | CQI and RI |
| Scheduler | MCS, layers, PRBs and scheduling frequency |
| Outcome | BLER, HARQ and throughput |
| Context | Load, position, UE state and test contract |
Step 4: compare a known-good interval
Change one major boundary:
- position;
- time and load;
- cell or sector;
- UE;
- server or path;
- SIM or policy.
Step 5: stop at the evidence boundary
If only one KPI supports the diagnosis, the diagnosis is not closed.
Field checklist
- [ ] The reference resource is named.
- [ ] Cell-level and per-index results are not mixed.
- [ ] The measurement and traffic intervals are aligned.
- [ ] RSRP, RSRQ and SINR are read separately.
- [ ] CQI is not presented as the scheduled MCS.
- [ ] MCS and layers are read with allocation.
- [ ] BLER and HARQ outcome are included.
- [ ] Throughput has a named measurement point.
- [ ] Load, position and UE state are recorded.
- [ ] A known-good comparison exists.
Field stop rule
RSRP may explain that a reference resource is strong or weak. It does not, alone, explain the scheduler decision or the final application result.
Continue the workflow
- Split a low-throughput problem into evidence branches.
- Separate SSB results from the data-beam question.
- Read the complete field guide.
Public technical references
- ETSI TS 138 215 V18.4.0, NR physical-layer measurements.
- ETSI TS 138 214 V18.9.0, NR physical-layer procedures for data.
- ETSI TS 138 314 V18.0.0, NR Layer 2 measurements.
- ETSI TS 138 331 V18.9.0, NR RRC protocol specification.
KEEP THE EVIDENCE PATH