An NR trace can show a cell-level result and measurements for individual SS/PBCH block indexes. Lower layers may manage the beam used at a given instant without RRC knowing that beam. Meanwhile, successful traffic also depends on control reception, scheduling, interference, rank, retransmissions and the beam applied to the relevant channels.
This makes a familiar sentence unsafe:
“SS-RSRP is good, so the beam is good.”
Before accepting it, ask:
- Is the value cell-level or tied to one SSB index?
- Which reference signal and reporting configuration produced it?
- What evidence connects the measured SSB to the control or data transmission?
- Are the measurement, beam event and traffic symptom on the same timeline?
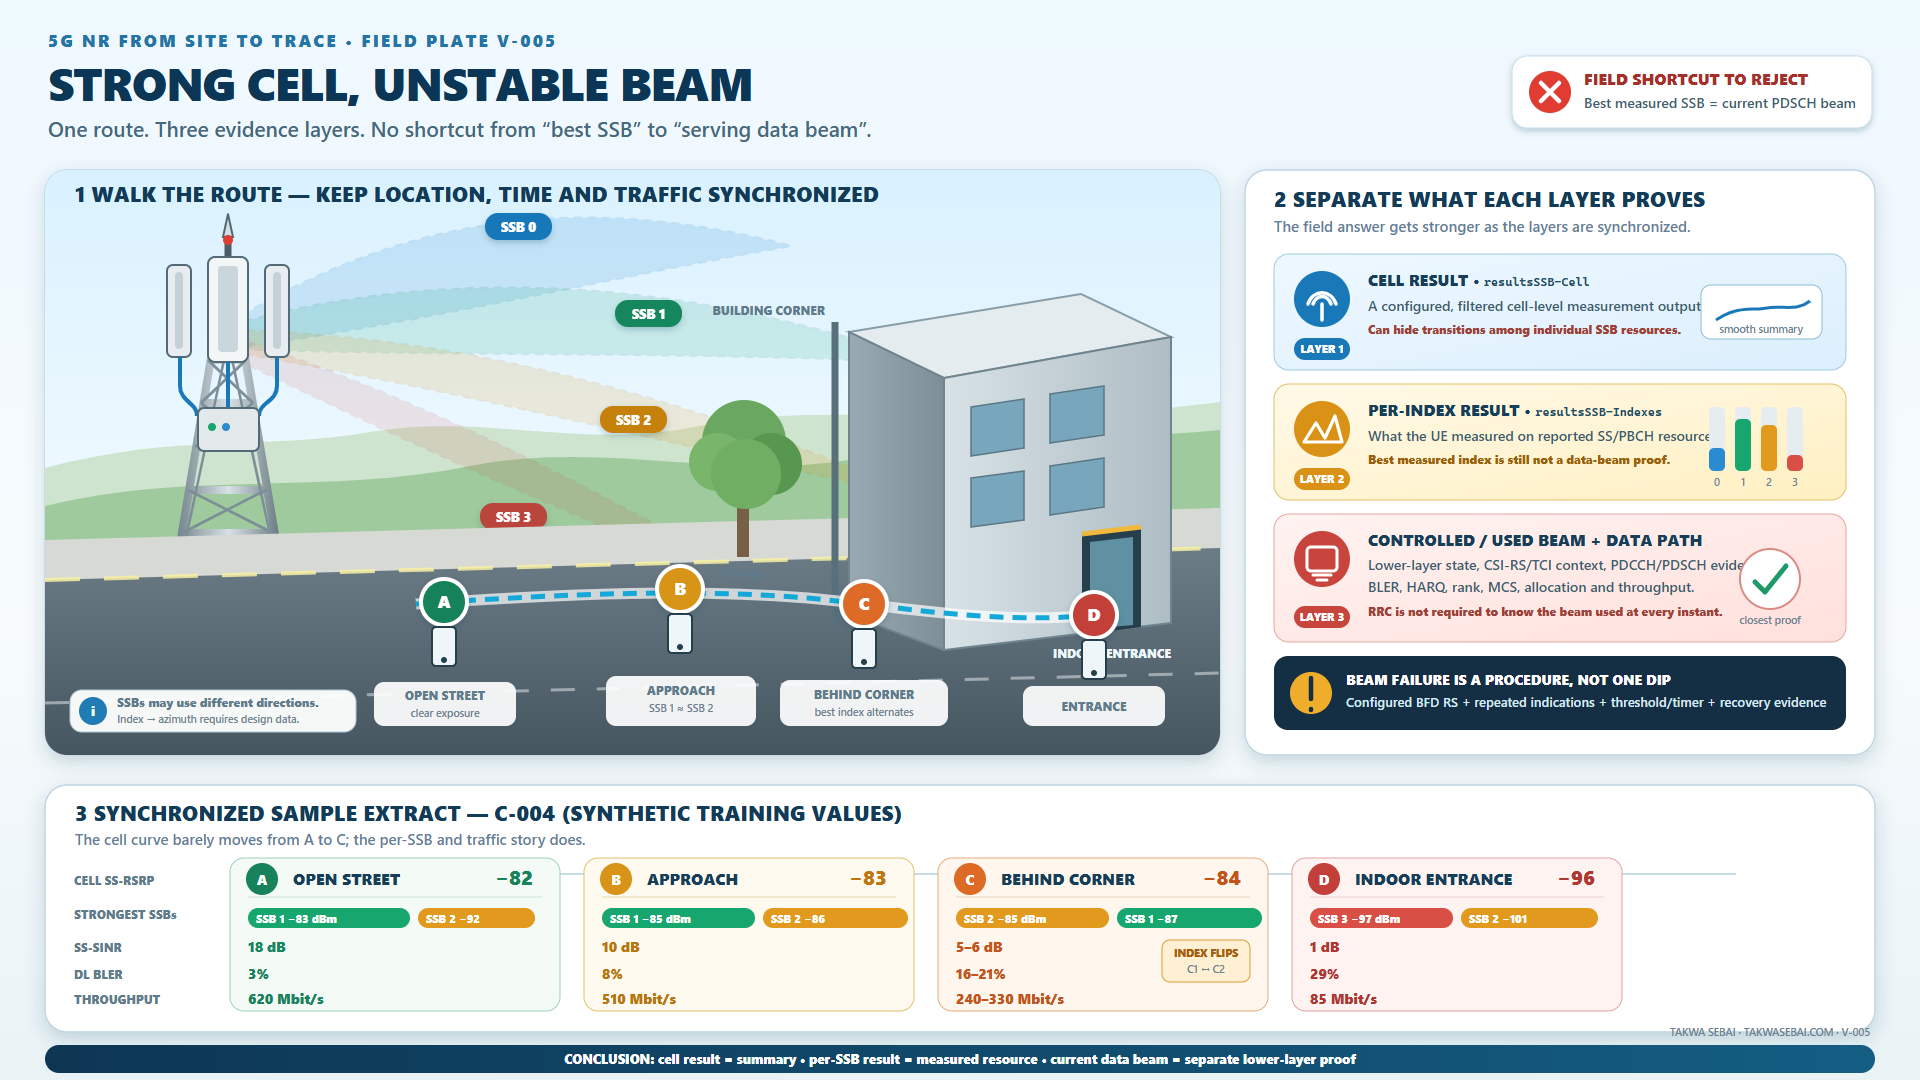
Original Takwa Sebai field interpretation map. The route, lobes, SSB-index positions and numbers are synthetic. They are not a live antenna pattern or universal threshold table.
What the SS/PBCH block contains
The SS/PBCH block, normally shortened to SSB, combines:
- Primary Synchronization Signal, PSS;
- Secondary Synchronization Signal, SSS;
- Physical Broadcast Channel, PBCH;
- the demodulation reference signal associated with PBCH.
This structure supports cell search, synchronisation and acquisition of broadcast information. It also provides reference resources used by several measurement and beam-management procedures.
It is not a complete representation of every channel experienced by the UE.
PDCCH and PDSCH can involve different reference signals, scheduling decisions and beamforming relationships. A UE can detect a strong SSB and still have control-channel, interference, retransmission or data-beam problems.
The safe rule is:
An SSB result is evidence about the measured synchronization-signal resource, not automatic evidence about every downlink channel.
SSB index is not a physical azimuth
Several SSBs can occur in the defined half-frame structure. Their time positions depend on the applicable SCS, while the network configures SSB periodicity.
In a beamformed deployment, different SSBs in a half-frame may use different spatial directions. The standard permits this behaviour. It does not reveal:
- the antenna implementation;
- the physical beam count;
- the azimuth of an SSB index;
- the exact footprint;
- the beam used for a PDSCH transmission.
An SSB index is therefore not automatically:
- a compass bearing;
- one fixed lobe;
- one antenna element;
- a vendor-independent beam ID;
- the current traffic beam.
Without approved design mapping, say:
The UE reported SSB index 2 as the strongest configured SSB resource in this sample.
Do not say:
The UE used the 70-degree traffic beam.
The second sentence invents a physical mapping that the measurement alone does not contain.
Quasi co-location does not make every beam identical
The physical specification defines assumptions for SS/PBCH blocks under specific index and frequency conditions. Those rules help the UE interpret reference signals over time.
They do not justify treating every SSB index, CSI-RS, transmission-configuration state and data transmission as one physical beam.
When a tool displays the word “beam”, identify the underlying object:
- SSB index;
- CSI-RS resource;
- transmission configuration indication state;
- beam-failure detection resource;
- chipset or supplier internal identifier;
- antenna-design beam.
The decoded object and its configuration are the evidence. The display label is not.
Five procedures that must not be collapsed
| Procedure | Question it answers | Evidence |
|---|---|---|
| Cell search | Can the UE find the cell and obtain broadcast context? | PSS/SSS detection, PBCH DM-RS and decode |
| RRM measurement | What cell and reference-signal results can the UE derive and report? | measurement objects, report config, SS-RSRP/RSRQ/SINR and SSB indexes |
| Beam management | Which spatial relationship should lower layers evaluate or use? | configured SSB/CSI-RS resources, commands and reports where available |
| Beam-failure detection and recovery | Has the configured failure process met its condition, and what recovery follows? | BFD resources, indications, counters, timers, random access or BFR signalling |
| Traffic diagnosis | Was useful control and data delivered in the same interval? | PDCCH/PDSCH, MCS, rank, BLER, HARQ, allocation and throughput |
The common mistake is to answer the traffic question with only the RRM measurement row.
Read SS-RSRP, SS-RSRQ and SS-SINR precisely
SS-RSRP
SS-RSRP is a received-power measurement on defined reference-signal resource elements. It is useful for level comparison.
It does not describe the complete interference environment, scheduler state or data-channel performance.
SS-RSRQ
SS-RSRQ relates SS-RSRP to NR carrier RSSI over the relevant resource set:
N × SS-RSRP / NR carrier RSSI
The RSSI contribution includes total received power from several sources under the defined measurement conditions. Two positions can therefore have similar SS-RSRP and different SS-RSRQ.
SS-SINR
SS-SINR compares applicable reference-signal power with interference plus noise. It is closer to a quality ratio than SS-RSRP.
It remains a reference-signal measurement, not a direct throughput forecast.
Do not manufacture universal thresholds
No single table turns every SS-RSRP, SS-RSRQ or SS-SINR value into universally “good”, “acceptable” or “bad”.
Before using a project threshold, record:
- band and channel bandwidth;
- SSB measurement configuration;
- device and logging mode;
- mobility and traffic state;
- indoor or outdoor context;
- KPI definition;
- service objective;
- time and spatial aggregation.
A project threshold can be useful. It should be labelled as a project criterion, not a law of NR.
Keep three evidence levels separate
Level 1: cell-level result
RRC measurement results can include a cell-level SSB result. This is often the smooth line displayed on a summary chart.
Its filtering and derivation matter. A cell-level curve can hide movement between individual SSB resources.
Level 2: per-SSB-index result
When configured, the report can include results for individual SSB indexes. Reporting configuration determines which quantities appear and how many indexes may be reported.
These results answer:
What did the UE measure on the reported SSB resources?
They do not prove which spatial state was applied to every PDCCH or PDSCH.
Level 3: controlled or used beam
Beam-level mobility can be handled within lower layers. 3GPP notes that RRC is not required to know which beam is being used at a given instant.
An RRC trace may therefore show the measurement configuration and reports while remaining insufficient to reconstruct the instantaneous data beam.
Stronger evidence may include:
- lower-layer beam state or commands;
- configured CSI-RS and TCI state;
- network beam or precoder telemetry;
- chipset diagnostics tied to the same timestamp;
- PDCCH/PDSCH decoding and performance;
- approved antenna-design mapping.
The stopping rule is simple:
Best measured SSB index is not the same as a proven serving PDSCH beam.
Synthetic route: the cell curve hides the transition
This case is synthetic. It contains no customer data and is not presented as the author's field experience.
A UE follows a short n78 route:
- A: open street;
- B: approaching a building corner;
- C: behind the corner;
- D: indoor entrance.
A download runs during the route. The imaginary logger exports cell-level SS-RSRP, selected per-index results and traffic KPIs at aligned samples.
| Position | Cell SS-RSRP | Reported strongest SSB results | SS-SINR | DL BLER / throughput |
|---|---|---|---|---|
| A | -82 dBm | SSB 1: -83; SSB 2: -92 dBm | 18 dB | 3% / 620 Mbit/s |
| B | -83 dBm | SSB 1: -85; SSB 2: -86 dBm | 10 dB | 8% / 510 Mbit/s |
| C1 | -84 dBm | SSB 2: -85; SSB 1: -87 dBm | 6 dB | 16% / 330 Mbit/s |
| C2 | -84 dBm | SSB 1: -85; SSB 2: -86 dBm | 5 dB | 21% / 240 Mbit/s |
| D | -96 dBm | SSB 3: -97; SSB 2: -101 dBm | 1 dB | 29% / 85 Mbit/s |
These are teaching values, not measurements.
At B and C:
- cell-level SS-RSRP changes only slightly;
- two SSB results are close;
- the reported strongest index alternates;
- SS-SINR falls;
- BLER rises;
- throughput falls.
The evidence supports a focused beam and interference investigation.
It does not prove:
- the index change caused the throughput loss;
- each index maps to the lobe drawn in the figure;
- PDSCH used the strongest reported SSB beam;
- a beam-failure procedure occurred;
- the network configuration is defective.
The next request should be for lower-layer beam evidence or the closest valid proxy, measurement configuration, PDCCH/PDSCH condition, HARQ/BLER and scheduler context over the same samples.
Beam change is not beam failure
Normal beam management may change a preferred spatial relationship. Beam failure is a specific configured process.
One weak SSB sample, one best-index change, one throughput dip or one random-access event is not enough to claim beam failure.
A defensible beam-failure conclusion requires:
- configured detection resources;
- applicable threshold, counter and timer context;
- the sequence of failure indications or closest approved decoded evidence;
- declaration event;
- recovery action and outcome;
- synchronized radio and traffic context.
If those layers are unavailable, report “suspected beam-quality instability”, not “beam failure confirmed”.
Field workflow
1. Lock the serving context
Record:
- NR-ARFCN, band, PCI and cell identity;
- SSB SCS and periodicity where available;
- measurement object and report configuration;
- configured SSB set;
- device, software and logger version.
2. Preserve cell and per-index results
Keep:
- cell-level SS-RSRP, SS-RSRQ and SS-SINR;
- per-index results;
- timestamps;
- position and motion;
- missing-sample indicators.
Do not keep only the best index. The second and third resources may explain instability near a boundary.
3. Reconstruct reporting rules
Check:
- which SSBs were configured for measurement;
- sorting quantity;
- maximum indexes in the report;
- beam-result inclusion;
- filters and reporting interval;
- extra averaging by the tool.
A missing index can mean “not reported under this configuration”, not “not transmitted”.
4. Add lower-layer evidence
Use the strongest approved source available. If the tool exposes only SSB measurements, say so.
5. Synchronize traffic
Align:
- PDCCH decoding or control failures;
- MCS, rank and allocation;
- DL/UL BLER;
- HARQ;
- throughput at a defined layer;
- application or transport limits;
- network load where available.
6. Label the conclusion
Use one of four labels:
- measured: directly present in decoded data;
- configured: present in RRC or network configuration;
- correlated: aligned variables move together, causality unproven;
- inferred: best explanation from incomplete evidence.
This prevents a plausible hypothesis from becoming a false root cause.
Final checklist
- [ ] Serving frequency, PCI and cell are fixed.
- [ ] Measurement configuration is preserved.
- [ ] Cell and per-index results are not mixed.
- [ ] No index is assigned an azimuth without design evidence.
- [ ] Best SSB is not called the PDSCH beam without proof.
- [ ] Location, time, motion and traffic are aligned.
- [ ] RSRP is not used as a substitute for quality.
- [ ] Control, data, BLER, HARQ and allocation are checked.
- [ ] A beam-failure claim includes detection and recovery evidence.
- [ ] Thresholds are identified as project criteria.
- [ ] Synthetic values remain visibly declared.
Continue the evidence chain
- Read RSRP, RSRQ and SINR with traffic evidence.
- Follow control from PDCCH to PDSCH.
- Use the low-throughput diagnostic tree.
- Read the complete 5G NR field guide.
Download the free illustrated 111-page ebook.
Technical sources
- 3GPP TS 38.211 V18.9.0, especially clause 7.4.3. ETSI publication.
- 3GPP TS 38.215 V18.4.0, especially clauses 5.1.1, 5.1.3 and 5.1.5. ETSI publication.
- 3GPP TS 38.300 V18.9.0, especially clauses 5.2.4, 5.2.5.3, 9.2.3.1 and 9.2.8. ETSI publication.
- 3GPP TS 38.331 V18.9.0, especially clauses 5.5.3 and 5.5.5 and
MeasResultNR. ETSI publication.
KEEP THE EVIDENCE PATH