A user reports unstable service. The radio level is not obviously poor. The site is reachable. One sector behaves differently from the other two.
Where should the investigation begin?
The answer is not automatically “RF”, “transport” or “the scheduler”. A 5G service crosses physical equipment, power, timing, optical links, distributed processing, centralised functions, transport and the core. The first job is to map the symptom onto that complete chain.
This guide connects three views:
- the physical site;
- the logical gNB and protocol stack;
- the evidence available at each point.
It is deliberately vendor-neutral. An RU or AAU shown on a field map does not prove a particular functional split or fronthaul implementation.
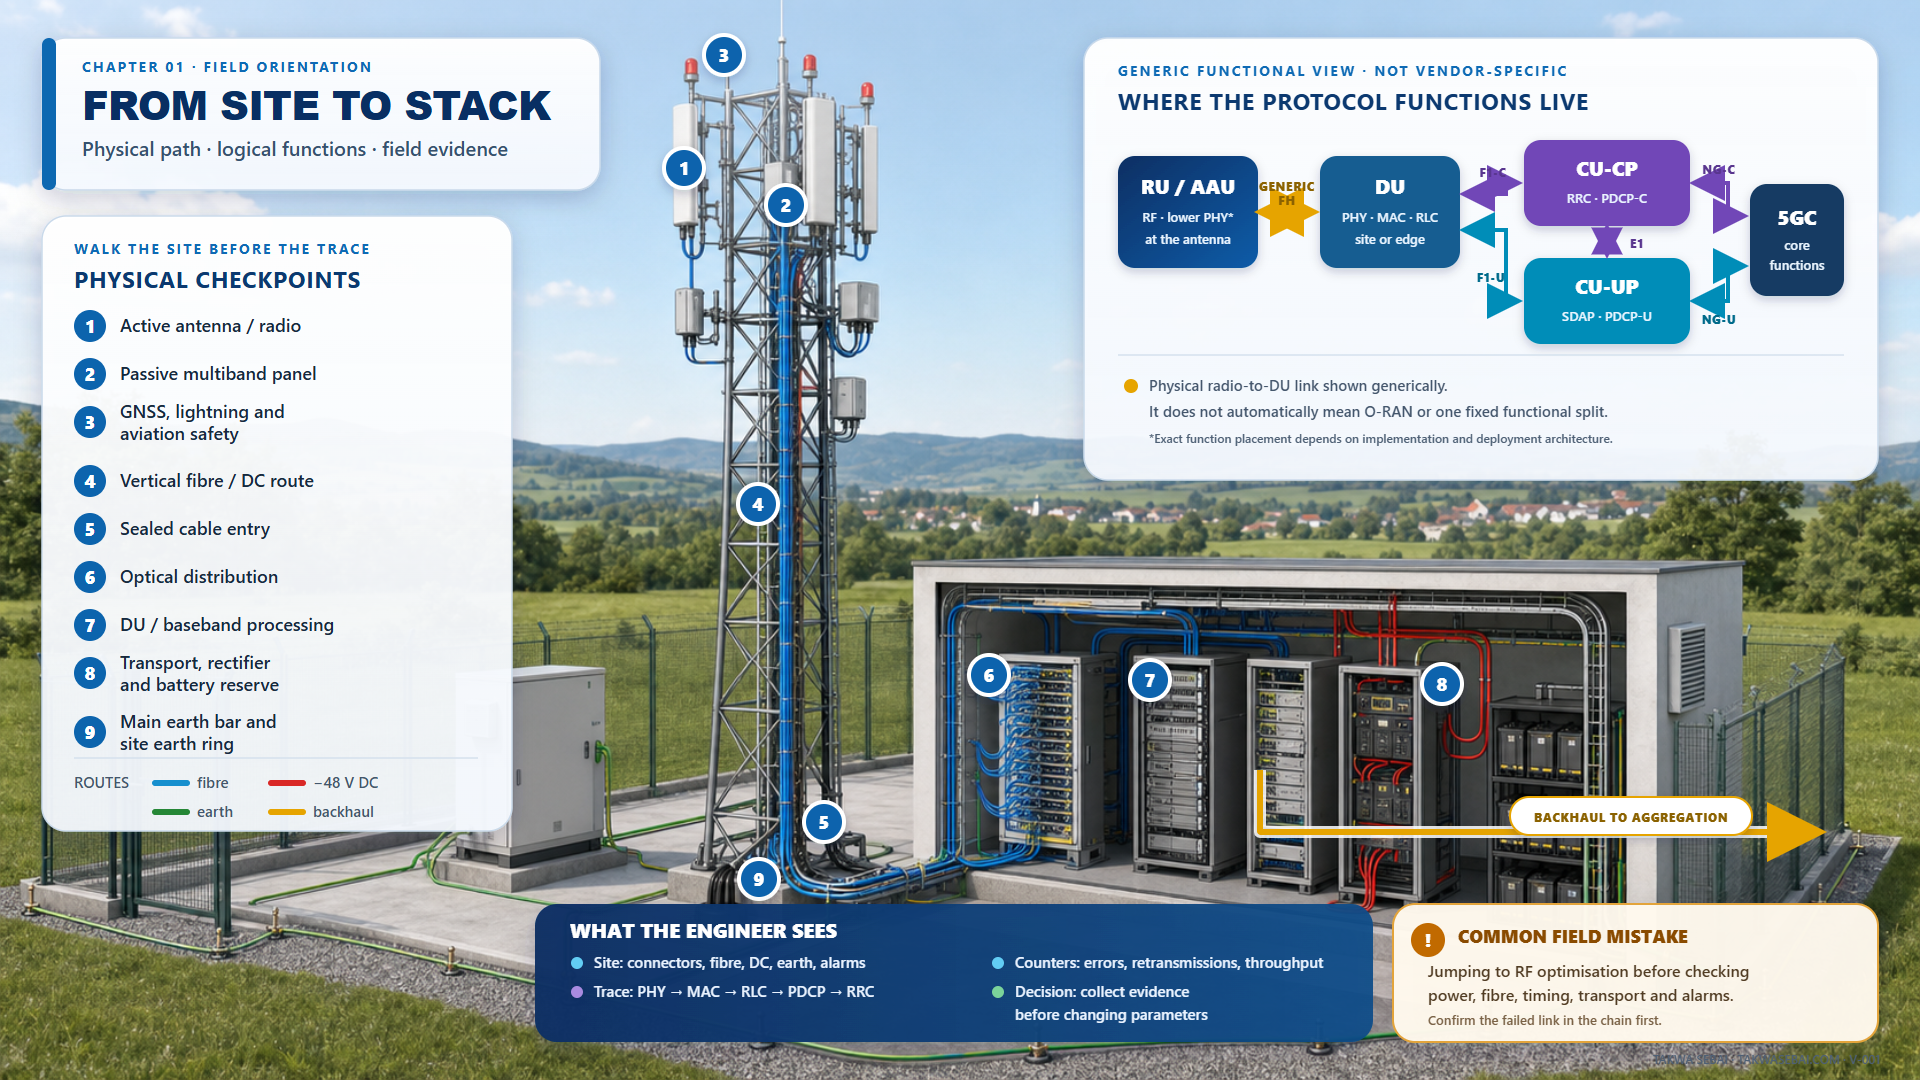
Original Takwa Sebai field plate. The physical layout is generic. The DU/CU functional map is aligned with 3GPP TS 38.401; the radio-to-DU link must be verified against the actual deployment.
The practical end-to-end path
For field orientation, read the path in this order:
UE ↔ antenna/radio ↔ physical radio-to-DU path ↔ DU ↔ CU ↔ transport/core ↔ service
Then add the dependencies that cut across several logical layers:
- DC power and battery reserve;
- protective earth and bonding;
- timing and synchronisation;
- software and configuration;
- alarms and management reachability;
- environmental conditions.
These dependencies are why a clean protocol diagram is not enough. A timing issue can resemble radio interference. A transport limit can produce poor application throughput while RF indicators remain healthy. A marginal power or optical link can be intermittent and disappear before the engineer reaches the site.
The useful question is therefore not only:
Which KPI is degraded?
It is:
Which physical or logical segment could create this complete set of observations?
Walk the physical path before abstracting it
The exact equipment depends on the operator and supplier, but a disciplined walk normally includes the following checkpoints.
1. Antenna and radio branch
Confirm:
- the affected sector, carrier and radio identity;
- mounting condition and visible damage;
- connector and weather-protection condition where applicable;
- temperature, restart and lower-layer alarm history;
- whether the symptom follows one radio, one sector or several;
- whether the current configuration matches the intended design.
A visually correct installation does not prove healthy RF performance. A clear current alarm list does not prove that the link was stable during the failure window.
2. Passive antenna paths
A site may also contain passive multiband panels, feeders, combiners or remote radio equipment. This matters in NSA, inter-RAT mobility and multi-band service.
Before drawing a conclusion, determine which antenna system serves the affected carrier and whether the symptom follows a band, sector or shared physical element.
3. Timing and synchronisation
Collect:
- synchronisation source and lock state;
- historical timing alarms;
- recent GNSS, PTP or transport-timing changes;
- correlation with neighbouring cells;
- the exact start time of the degradation.
Do not treat timing as an afterthought. A synchronisation problem may affect availability, TDD behaviour or apparent interference across more than one cell.
4. Fibre and DC routes
The vertical path between tower-top equipment and the technical area is a diagnostic object in its own right. It can be exposed to bend stress, damaged glands, water ingress, vibration, heat or accidental disturbance.
Useful evidence includes:
- optical transmit and receive levels when exposed by the equipment;
- loss-of-signal, flap and error history;
- DC alarms and approved voltage-drop evidence;
- inspection of bends, clamps, cable entry and labels;
- the timing of physical work compared with the first counter change.
One isolated optical measurement may miss an intermittent fault. It should be aligned with the equipment error history.
5. Optical distribution and cable entry
Logical diagrams hide patching reality. A distribution point can contain crossed labels, spare fibres, contamination or changes that were not carried into the as-built record.
A useful test records:
- expected endpoints;
- measurement method;
- reference or known-good level;
- connector state before and after intervention;
- counters from the same time window.
6. DU or baseband processing
In the generic 3GPP functional split used here, the gNB-DU hosts PHY, MAC and RLC. This is where the investigation can connect:
- cell and carrier availability;
- decoding and HARQ behaviour;
- scheduling and resource use;
- RLC behaviour;
- lower-layer alarms;
- the exact UE, cell and interval.
The physical DU may be on site or at another edge location. The logical role matters more than the cabinet position.
7. Transport, power and battery reserve
These are different functions and should not be mixed.
For transport, check interface history, loss, latency, congestion, routing or QoS changes, and the first degraded measurement point.
For power, check current and historical alarms, supply stability under approved procedures, protection state and recent load or cabling changes.
For batteries, check alarms, maintenance history, repeated mains events and authorised capacity-test results.
“No outage” does not mean “healthy power”. A marginal supply can cause instability without producing a long site-down event.
8. Grounding and bonding
Grounding is safety-critical and site-specific. It must be inspected by qualified personnel under the applicable design and regulation.
For diagnosis, record approved observations such as visible bonding integrity, corrosion, recent civil work or correlation with weather and electrical events. Do not turn a safety observation directly into an RF root-cause claim.
Map the physical site to the logical gNB
3GPP separates logical functions from their physical packaging.
gNB-DU
The gNB-DU hosts:
- PHY;
- MAC;
- RLC.
It connects to the gNB-CU-CP through F1-C and to the gNB-CU-UP through F1-U.
gNB-CU-CP
The control-plane CU hosts:
- RRC;
- the control-plane part of PDCP.
It connects to the DU over F1-C and to the gNB-CU-UP over E1.
gNB-CU-UP
For a gNB, the user-plane CU hosts:
- SDAP;
- the user-plane part of PDCP.
It connects to the DU over F1-U, to the CU-CP over E1 and toward the user-plane core over NG-U.
The RU/AAU warning
TS 38.401 defines the DU and CU functions above. It does not turn every physical RU/AAU box into a universal 3GPP node with one mandatory fronthaul split.
Before using O-RAN, CPRI, eCPRI or a supplier-specific interpretation, identify the actual architecture and its documentation.
Where each type of evidence appears
| Area | Useful evidence | What it can support | What it cannot prove alone |
|---|---|---|---|
| Physical site | condition, routing, connector state, alarms | physical hypothesis and test location | service impact or root cause |
| RF measurements | level, quality, interference-related indicators | radio condition at a place and time | scheduler, transport or policy health |
| PHY | decoding, HARQ, BLER, MCS and rank context | lower-layer behaviour | physical cause of that behaviour |
| MAC | scheduling, allocation, resource usage | capacity or scheduler hypothesis | application or transport performance |
| RLC | retransmission and buffer behaviour | delivery stress | which lower layer created the stress |
| PDCP/SDAP | volume and bearer/QoS context | user-plane and bearer analysis | server health |
| RRC | connection, reconfiguration and mobility signalling | control-plane state and failure phase | user-plane performance after setup |
| Transport | loss, latency, utilisation, interface errors | transport-path hypothesis | RF health |
| Power/timing | alarms, state changes and approved tests | cross-cutting infrastructure hypothesis | the affected protocol transaction |
The key operation is correlation. Align the evidence by:
- timestamp and timezone;
- site, sector and cell;
- UE or session identity when permitted;
- software and configuration version;
- before/after change window;
- affected and unaffected comparison.
Do not compare an hourly counter casually with a ten-second drive-test sample.
Translate the symptom into a first branch
Complete site unavailable
Start with common dependencies:
- mains, DC and rectifier state;
- transport reachability;
- mandatory timing;
- common DU or site-control function;
- planned work or configuration events.
Individual cell tuning is not a sensible first action when all cells disappeared together.
One sector or band degraded
Start with:
- the sector-specific radio and physical link;
- alarm and error history;
- carrier configuration differences;
- interference or coverage change;
- comparison with other sectors on the same site.
Radio level healthy, throughput poor
Start with:
- quality, BLER and retransmission context;
- allocation and scheduler availability;
- UE capability and active configuration;
- transport;
- policy, QoS, core and application path.
“Good RSRP” is not a throughput diagnosis.
Intermittent degradation
Start with:
- historical alarms and interface flaps;
- temperature, weather, power or timing correlation;
- recent physical work;
- load-dependent congestion;
- mobility or beam behaviour on a repeatable route.
Preserve evidence before a reboot when the service procedure allows it.
Synthetic exercise: a physical link wearing a radio mask
The following case is synthetic. It is a training exercise, not a customer event or a claim about the author's experience.
After planned work at a generic three-sector site, users on one sector report unstable throughput. The site remains reachable. The other two sectors behave normally.
The investigation records:
- no continuing site-down alarm;
- stable DC and timing state during the test;
- no congestion on the shared transport path;
- intermittent lower-layer errors on the affected sector;
- retransmission stress;
- a start time close to physical work on the cable route.
These facts narrow the scope. They do not prove a fibre fault.
A defensible test sequence is:
- freeze unrelated parameter changes;
- export alarms and interface counters for the same interval;
- compare the affected sector with the other two;
- inspect the labelled fibre path under the approved procedure;
- test the optical path using the operator's accepted method;
- if authorised, compare with a known-good passive path with rollback prepared;
- confirm whether link errors and radio symptoms recover in the same window.
The lesson is precise:
A logical KPI identifies where stress appears. It does not automatically identify the physical cause.
The field evidence gate
Before changing a parameter, answer five questions.
| Gate | Question |
|---|---|
| Scope | Are the site, sector, cell, UE/service and time window identified? |
| Path | Is the first stressed physical or logical segment located? |
| Correlation | Are alarms, traces, counters and changes aligned? |
| Comparison | Is there a healthy sector, route, UE or interval? |
| Test | Can the next action falsify the hypothesis, and is rollback prepared? |
This is the difference between collecting many counters and building a diagnosis.
Continue the evidence chain
- Choose and verify 5G NR numerology.
- Separate configured and active bandwidth parts.
- Split low throughput into four testable branches.
- Read the complete 5G NR field guide.
Download the free illustrated 111-page ebook.
Technical source
The DU/CU definitions and F1/E1 architecture used in this article are based on 3GPP TS 38.401 V18.7.0, Release 18, clauses 3.1 and 6.1.2. ETSI publication.
KEEP THE EVIDENCE PATH